
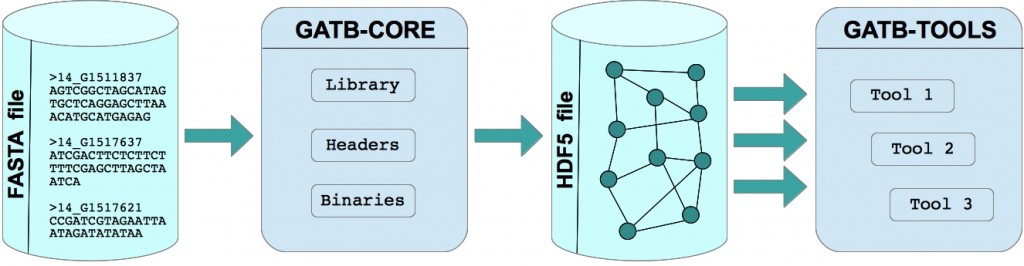
In a few words, GATB-Core takes a set of reads as an input (Fasta or Fastq files) and builds a structure representing these reads as a De Bruijn graph. The graph is saved in a HDF5 file. It is then loaded in memory in a tool (see GATB-TOOLS) to perform various genome analysis tasks.
One of the specificity of GATB-Core is its De Bruijn graph structure used for representing reads. From an historic point of view, the De Bruijn graph used in GATB-Core comes from the Minia software. Read more about GATB-Core concepts here. GATB-Core offers state of the art performance:
| Bacterial dataset | Whole human dataset | Large (meta-)genome (10-20 Gbp) | |
| Graph construction time | few minutes | 6 hours | 1-3 days |
| Memory usage | < 1 GB | < 10 GB | < 100 GB |